对接 Prometheus 监控
TapData 支持将运行时监控指标以 Prometheus 格式对外暴露,便于用户将 TapData 纳入自建监控体系中,实现统一的运行状态观测、趋势分析和告警配置。本文介绍如何启用监控、采集各组件指标并集成 Prometheus,同时可结合 Grafana 自定义可视化看板。
背景介绍
TapData 是一款实时数据同步与融合平台,支持多种异构数据源之间的高效传输、转换与集成。平台由多个核心组件组成,包括 Management 服务、API Server、Agent 和 Flow Engine,这些组件的稳定运行对保障任务执行的连续性和可靠性至关重要。
为了帮助用户全面掌握平台运行状况,TapData 提供了基于 Prometheus 的监控能力。各核心组件支持通过配置文件或环境变量开启监控功能,启用后将��运行指标以 Prometheus 格式通过 HTTP 接口对外暴露,便于接入现有的 Prometheus + Grafana 等可观测性平台,实现系统资源使用、任务状态等关键指标的采集、展示与告警。
与此同时,TapData 平台依赖 MongoDB 作为元数据存储服务。为了实现对 MongoDB 本身的运行状态进行统一监控,用户可以通过社区开源工具 mongodb_exporter 将 MongoDB 的内部性能指标(如连接数、操作统计、内存使用等)转化为 Prometheus 可采集的格式,从而与 TapData 的服务指标一并纳入统一的监控视图。
通过结合上述两种方法,帮助用户快速构建起完整的监控体系,覆盖 TapData 服务本身及其关键依赖组件,有效提升平台可观测性和运维响应效率。
前提条件
TapData 为 4.9.0 及以上版本
步骤一:启用监控
1.1 启用 TapData 服务监控
默认情况下,TapData 的监控功能未开启。当您需要使用第三方监控工具(如 Prometheus)时,可以通过配置文件或环境变量启用监控,从而暴露探活端点和监控指标端点。
- 通过配置文件启用
- 通过环境变量启用
登录 TapData 所属服务器,编辑 application.yml 文件,添加以下配置:
spring:
  # ... 其他配置,省略 ...
tapdata:
  # ... 其他配置,省略 ...
  metrics:
    enable: true         # 启用监控
    enginePort: 3035     # Flow Engine 监控端口,默认 3035
    agentPort: 3036      # Agent 监控端口,默认 3036
登录 TapData 所属服务器,设置下述变量信息
export TAPDATA_MONITOR_ENABLE=true        # 启用监控
export TAPDATA_FE_MONITOR_PORT=3035       # Flow Engine 监控端口,默认 3035
export TAPDATA_AGENT_MONITOR_PORT=3036    # Agent 监控端口,默认 3036
如 TapData 部署在多节点,需在每个节点上都添加配置。
1.2 启用 MongoDB 服务监控
TapData 依赖 MongoDB 存储用户配置、任务元数据等信息。为监控 MongoDB 的性能和健康状态,本方案采用开源工具 mongodb_exporter,从 MongoDB 实例中提取指标并转换为 Prometheus 格式,以便与 TapData 的服务指标一并纳入统一的监控视图。
- 登录 TapData 所依赖的 MongoDB 数据库,创建一个具有 clusterMonitor 角色的用户,确保其具备读取集群状态和性能指标的权限。
# 替换要创建的用户名和密码
use admin
db.createUser({
  user: "tapdata_monitor",
  pwd: "your_password",
  roles: [
    { role: "clusterMonitor", db: "admin" },
    { role: "read", db: "local" }
  ]
})
- 前往 mongodb_exporter releases 页面,下载适用于您环境的二进制文件。
本文以 0.47.1 版本为例,演示后续操作流程。
- 解压下载的文件,随后进入解压目录。
# 替换要解压的安装包名字
tar -xzvf mongodb_exporter-0.47.1.linux-amd64.tar.gz
cd mongodb_exporter-0.47.1.linux-amd64
- 后台启动 mongodb_exporter,采集 MongoDB 指标并后台运行,日志输出到 exporter.log
# 设置我们在前面创建的只读用户名和密码变量
export MONGODB_USER=tapdata_monitor
export MONGODB_PASSWORD=your_password

# 后台启动服务,日志输出到 exporter.log
# 注意替换 --mongodb.uri 为实际的 MongoDB 连接地址
nohup ./mongodb_exporter \
  --mongodb.uri="mongodb://192.168.1.18:27017" \
  --collector.diagnosticdata \
  --collector.replicasetstatus \
  --collector.replicasetconfig \
  --collector.dbstats \
  --collector.dbstatsfreestorage \
  --collector.topmetrics \
  --collector.currentopmetrics \
  --collector.indexstats \
  --collector.profile \
  --collector.shards \
  --collector.pbm \
  --no-compatible-mode \
  > exporter.log 2>&1 &
启动成功后,默认服务端口为 9216,路径为 /metrics,更多关于 mongodb_exporter 的配置和指标说明,请参考 mongodb_exporter 文档。
步骤二:集成到 Prometheus/Grafana
下文以 Docker Compose 部署 Prometheus 为例,演示如何集成 TapData 组件及 MongoDB 系统库的监控指标。如果尚未安装 Docker,参考 Docker 官方文档 安装。
-
登录至某个和 TapData 服务网络联通的服务器, 执行
mkdir prometheus && cd prometheus创建 Prometheus 配置目录。 本案例中,假设该服务器 IP 地址为 192.168.1.100,TapData 服务部署在 192.168.1.200 和 192.168.1.201 两台服务器上。 -
创建 docker-compose.yml 文件,添加 Prometheus 和 Grafana 服务配置,示例如下:
version: '3.7'
services:
  prometheus:
    image: prom/prometheus:latest
    container_name: prometheus
    volumes:
      - ./prometheus.yml:/etc/prometheus/prometheus.yml
      - prometheus_data:/prometheus  # 数据持久化
    ports:
      - "9090:9090"
    command:
      - '--config.file=/etc/prometheus/prometheus.yml'
      - '--storage.tsdb.path=/prometheus'
      - '--web.console.libraries=/etc/prometheus/console_libraries'
      - '--web.console.templates=/etc/prometheus/consoles'
      - '--storage.tsdb.retention.time=30d'  # 保留30天数据

  grafana:
    image: grafana/grafana:latest
    container_name: grafana
    ports:
      - "3000:3000"
    environment:
      - GF_SECURITY_ADMIN_USER=admin
      - GF_SECURITY_ADMIN_PASSWORD=admin
    volumes:
      - grafana_data:/var/lib/grafana  # 数据持久化

volumes:
  prometheus_data:
  grafana_data:
:::tips 重要提示
prometheus_data:存储 Prometheus 采集的监控数据,避免容器重启后数据丢失grafana_data:存储 Grafana 的配置、仪表板、数据源等设置
如果不配置数据持久化,执行docker compose down停止容器会删除所有数据,导致配置丢失! :::
- 创建
prometheus.yml文件,添加 TapData 组件及MongoDB 系统库的指标抓取作业,配置实例如下所示,支持多节点和自定义标签:
  scrape_configs:
    - job_name: 'tapdata-management'
      metrics_path: /actuator/prometheus
      scrape_interval: 5s
      relabel_configs:  # 可选:添加自定义标签
        - target_label: 'env'
          replacement: 'dev'
      static_configs:
        - targets:
          - '192.168.1.200:3030'  # 替换为实际 IP
          - '192.168.1.201:3030'  # 多节点配置,如为单节点,可删除此配置

    - job_name: 'tapdata-flow-engine'
      metrics_path: /actuator/prometheus
      static_configs:
        - targets:
          - '192.168.1.200:3035'
          - '192.168.1.201:3035'

    - job_name: 'tapdata-api-server'
      metrics_path: /metrics
      static_configs:
        - targets:
          - '192.168.1.200:3080'
          - '192.168.1.201:3080'

    - job_name: 'tapdata-agent'
      metrics_path: /metrics
      static_configs:
        - targets:
          - '192.168.1.200:3036'
          - '192.168.1.201:3036'

    - job_name: 'mongodb'
      metrics_path: /metrics
      static_configs:
        - targets:
          - '192.168.1.200:9216'
- 启动容器
docker compose up -d
上述配置已包含数据持久化,Prometheus 和 Grafana 的数据都会保存在 Docker 卷中,即使容器重启也不会丢失。
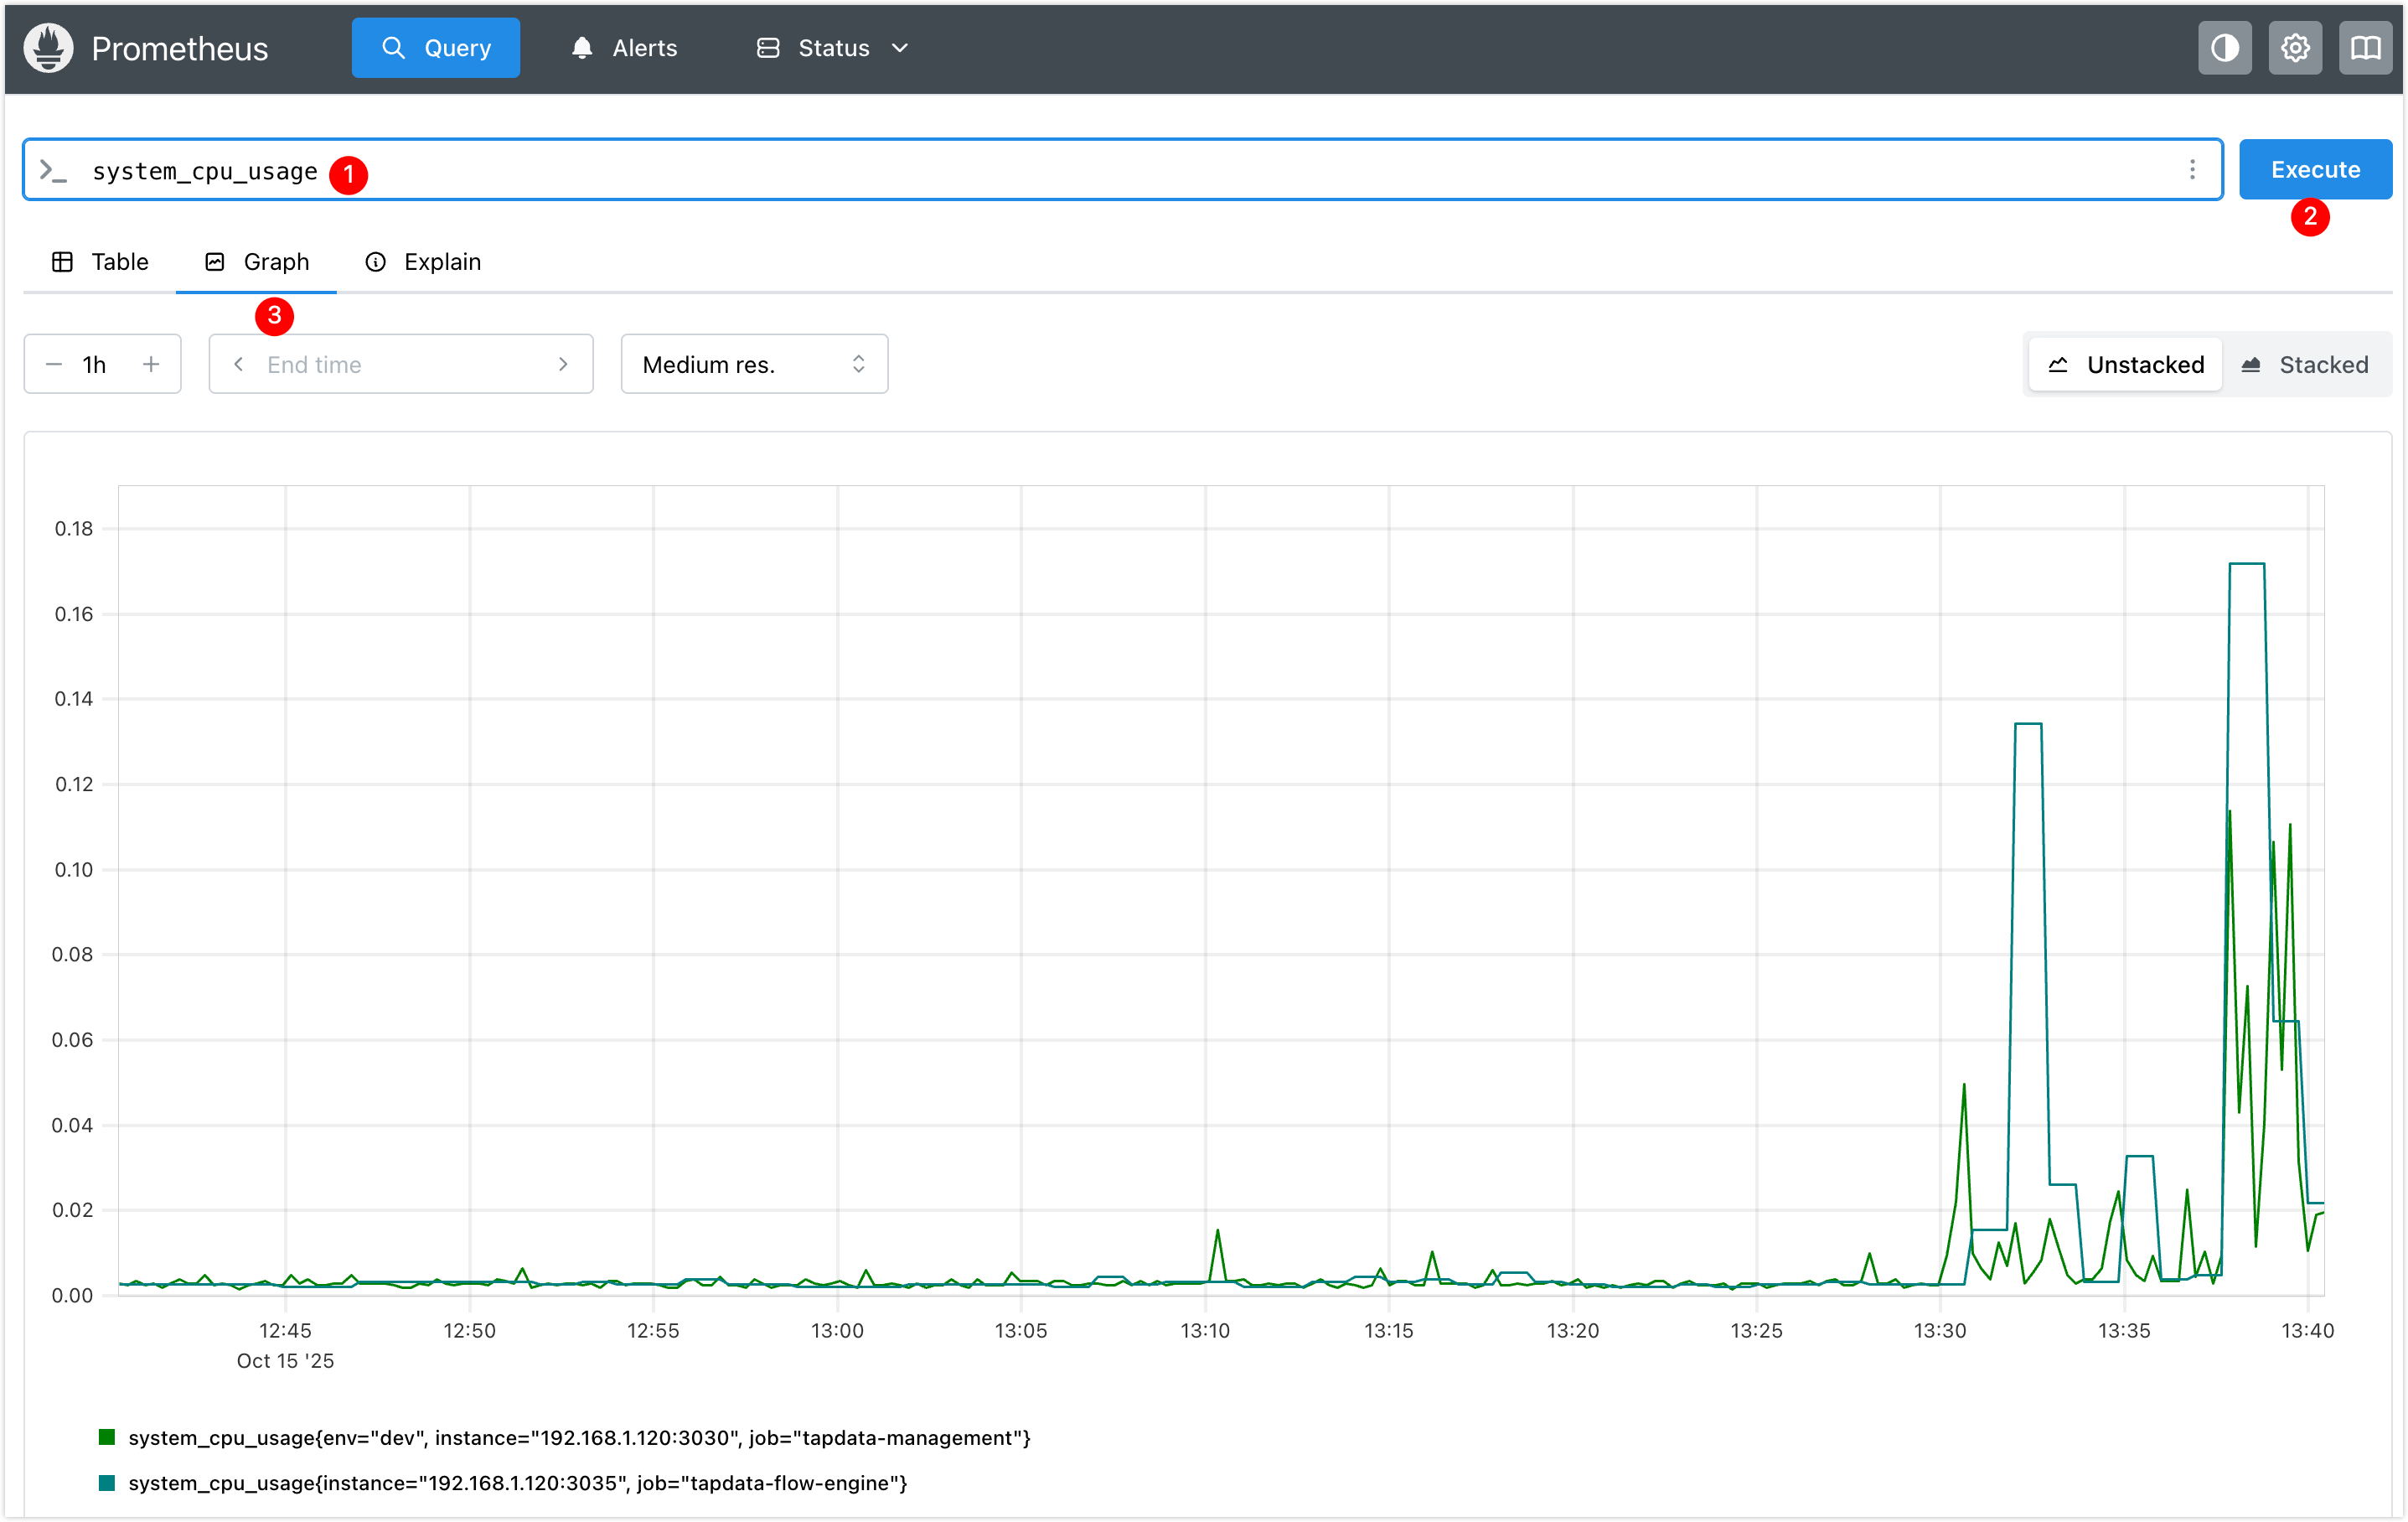
- 访问 Prometheus UI 地址
http://192.168.1.100:9090,查询某个指标,例如system_cpu_usage(系统 CPU 占用率),确认配置生效。
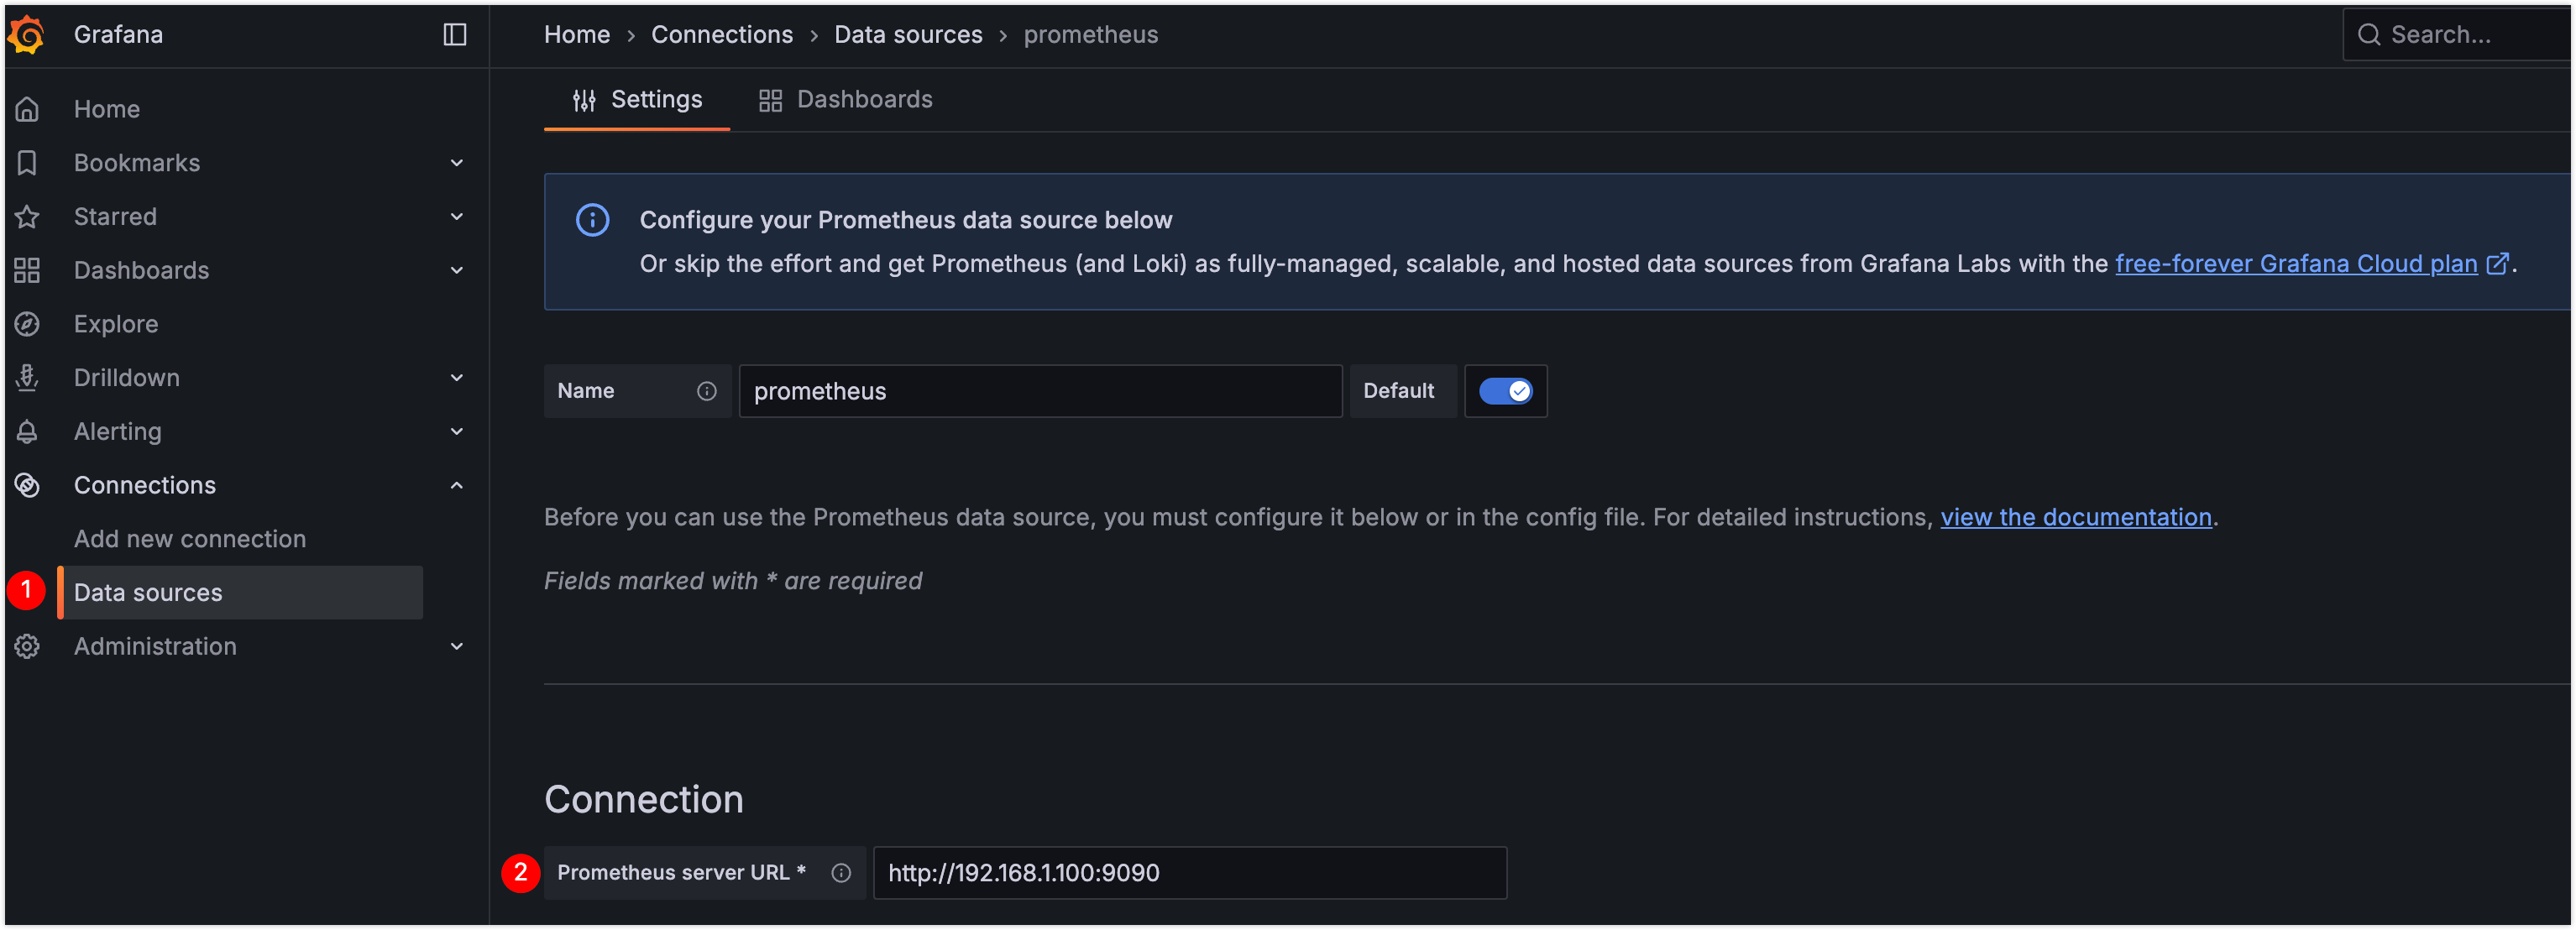
- 访问 Grafana UI 地址
http://192.168.1.100:3000,登录 Grafana 后,重置默认密码并添加 Prometheus 数据源,本案例中,配置地址为http://192.168.1.100:9090。
下图以监控 TapData Management 服务的磁盘总容量和可用容量为例,构建了自定义的可视化看板。更多设置介绍,见 Grafana Dashboards 使用介绍。
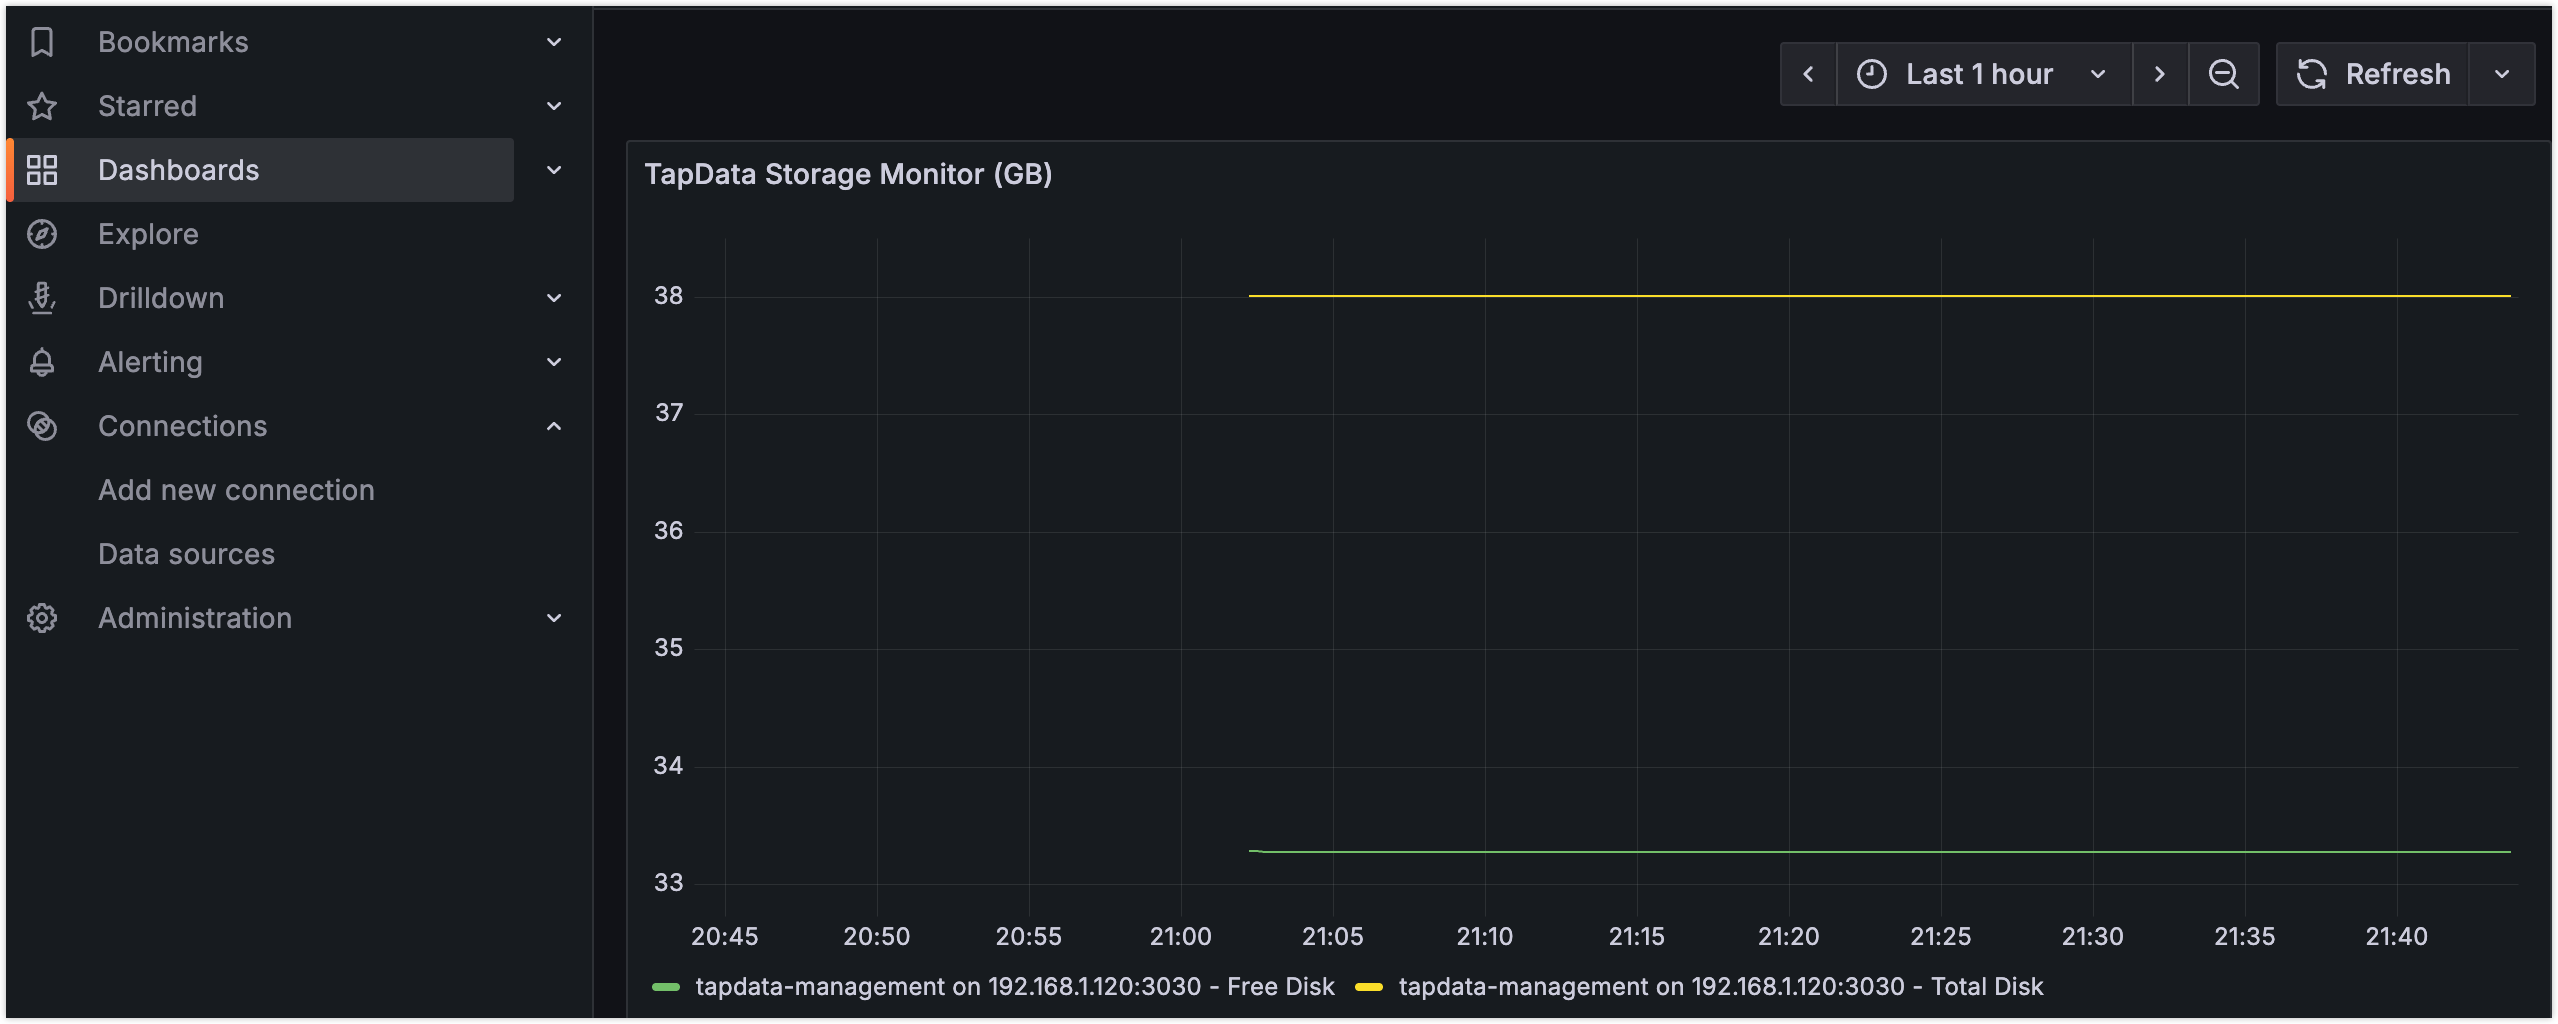
您也可以导入我们提供的 Grafana 仪表板模板,快速构建专业监控视图。
附录
Grafana 仪表板模板
为帮助您快速构建 TapData 监控体系,我们提供了经过实战验证的 Grafana 仪表板模板。导入后即可获得专业的监控视图,无需从零开始配置,具体如下:
| 模板名称 | 监控范围 | 下载链接 |
|---|---|---|
| TapData 服务监控 | 任务运行状态、系统资源、组件健康度 | TapData-Service-Template.zip |
| API 服务监控 | 请求统计、API 性能、资源使用 | API-Service-Template.zip |
| MongoDB 监控 | 查询性能、Oplog、集合统计 | Percona MongoDB 仪表板 |
使用方法
- 下载模板:点击上方链接获取 JSON 文件
- 导入 Grafana:Grafana → 右上角 + 图标 → Import dashboard
- 配置数据源:选择已添加的 Prometheus 数据源
- 调整变量:根据实际环境修改变量查询语句
效果预览
- TapData 监控
- API 监控
- MongoDB 监控
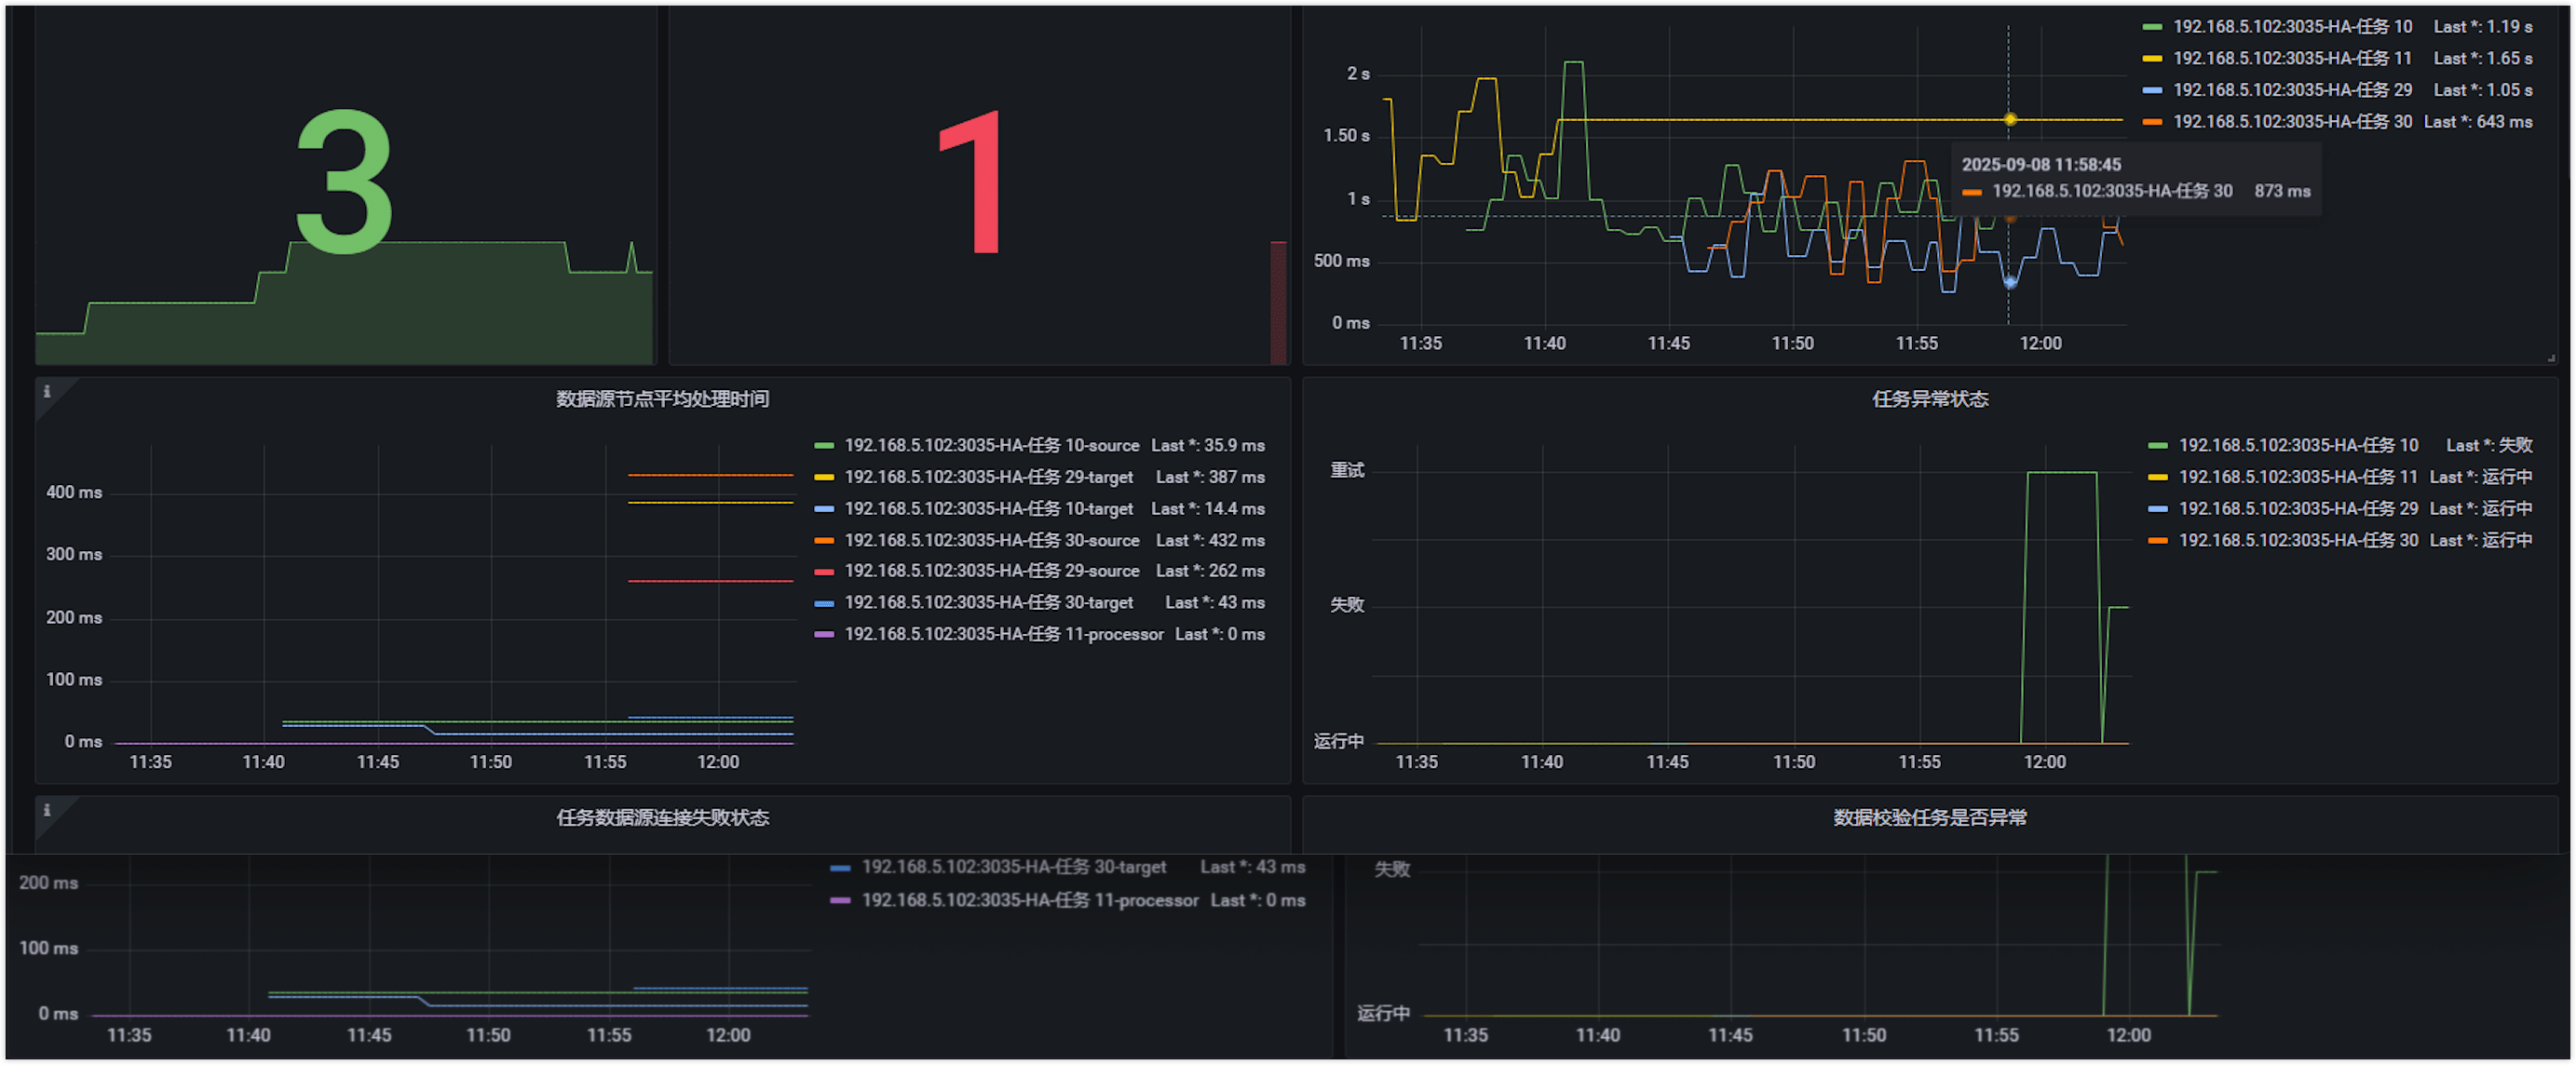
包含:任务延迟、节点状态、资源使用率等关键指标
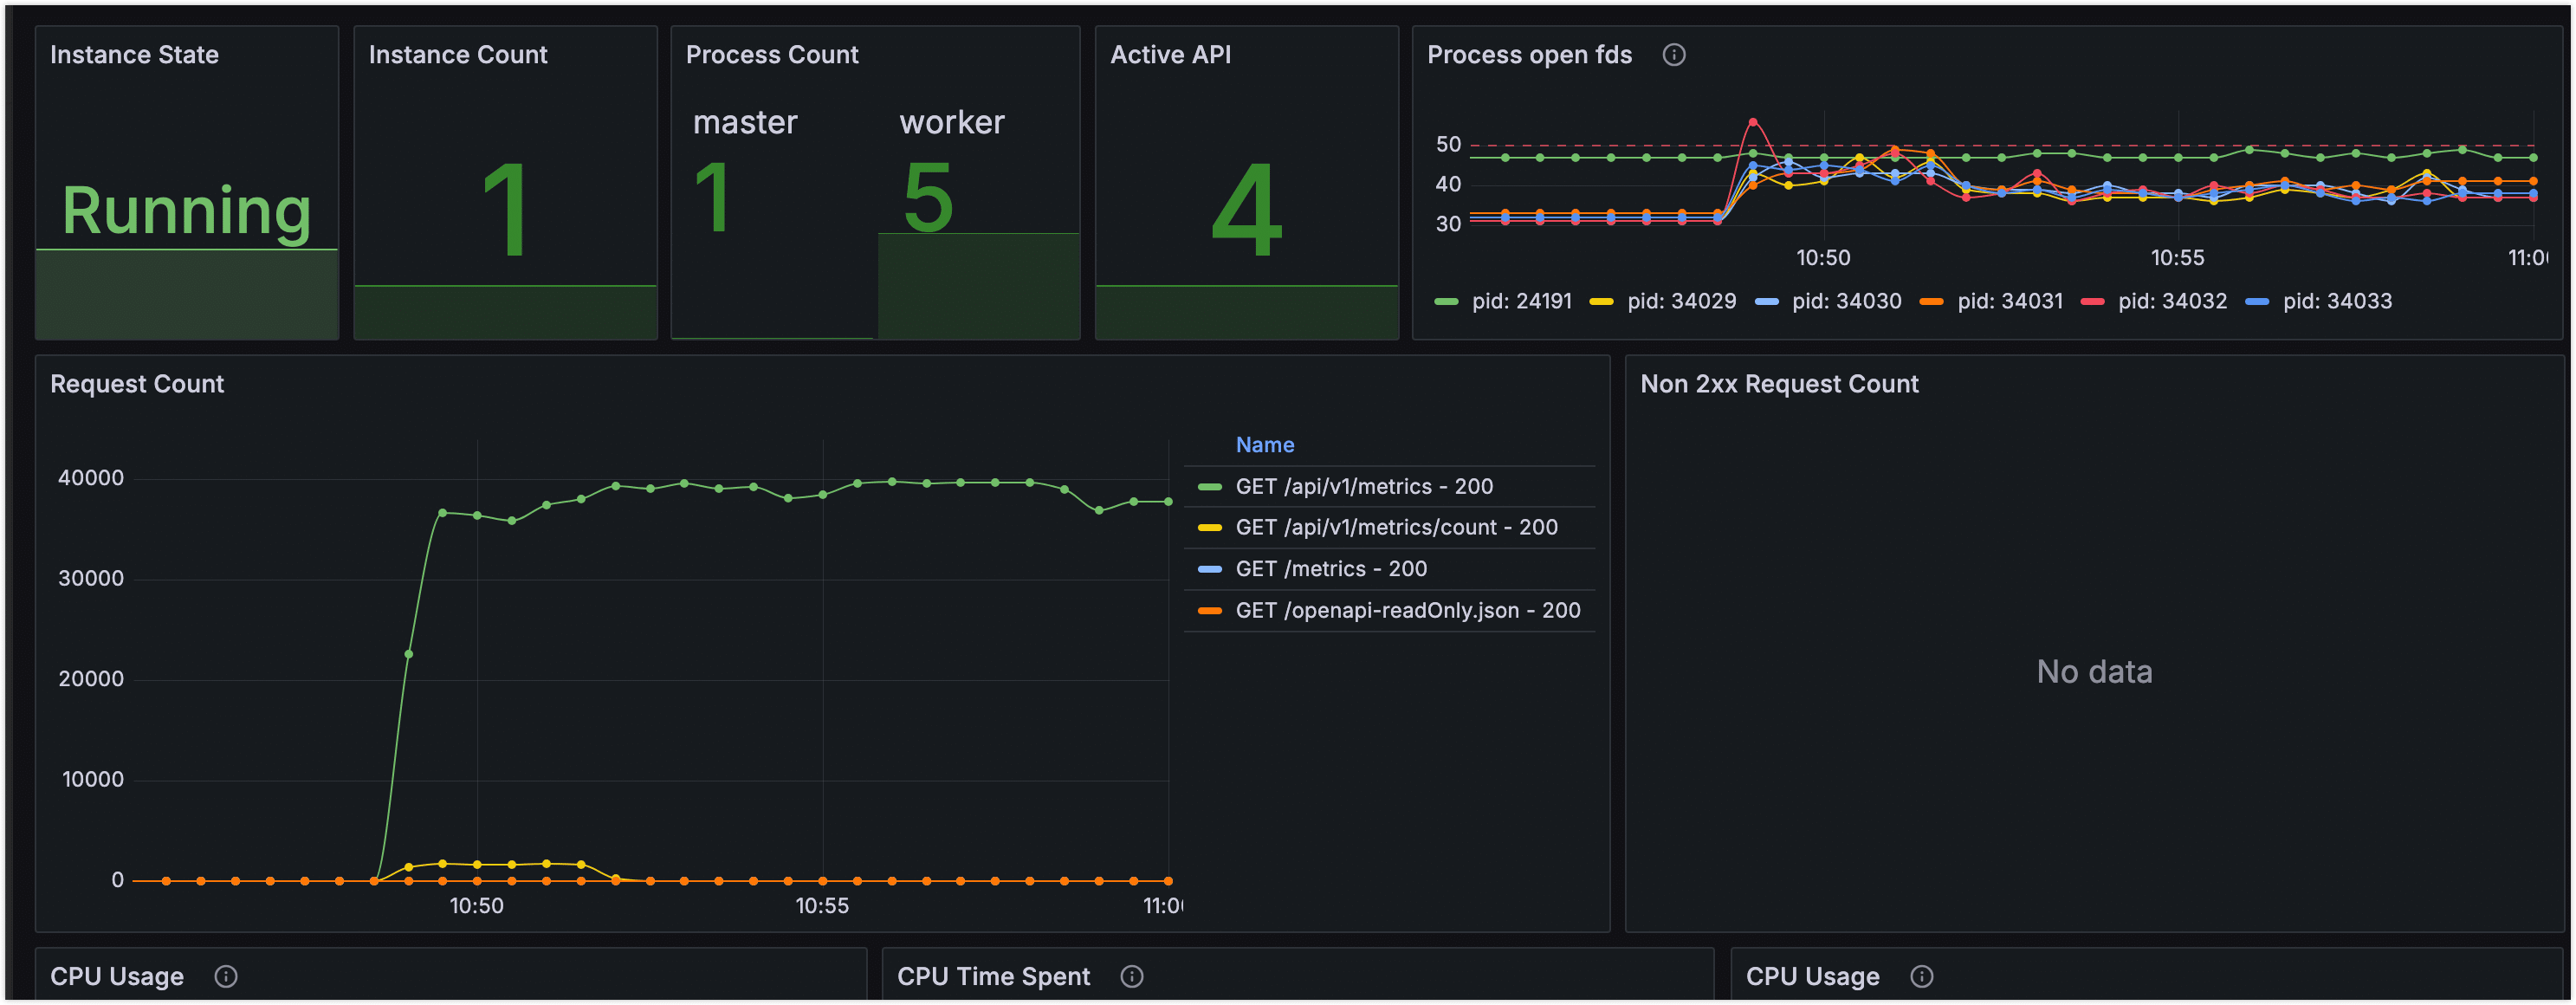
包含:请求量、响应时间、错误率等 API 核心指标
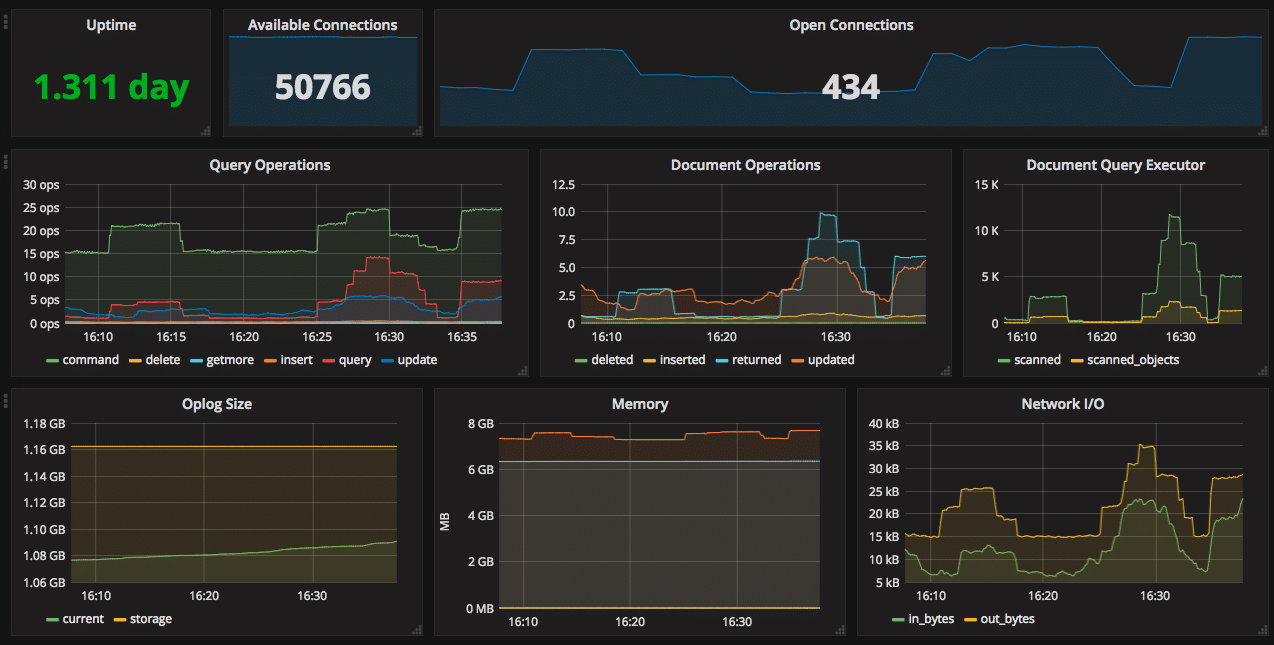
包含:查询性能、连接数、Oplog 状态等数据库指标
如导入后无数据显示,请检查、Prometheus 数据源是否配置正确、变量查询语句是否匹配实际标签名、指标采集端点是否可访问。
探活端点与指标说明
探活端点
所有 TapData 组件提供无需认证的 HTTP GET 探活端点,用于检查服务健康状态。返回 200 状态码表示服务正常,否则表示异常。以下是各组件的探活端点:
-
TapData Management:执行
curl http://127.0.0.1:3030/health检查服务健康状态,示例响应:{
"reqId": "47f18971-92d5-48ab-9bfd-581f39988e06",
"ts": 1758081846300,
"code": "ok"
} -
TapData ApiServer:执行
curl http://127.0.0.1:3080/status检查服务健康状态,示例响应:{
"status": "UP"
} -
TapData Agent:执行
curl http://127.0.0.1:3036/health检查服务健康状态,示例响应如下所示,如果未启用监控,可通过检查进程 PID 判断健康。{
"status": "ok",
"date": "2025-09-17T04:15:00.281Z",
"pid": 78193,
"platform": "darwin"
} -
TapData Flow Engine:执行
curl http://127.0.0.1:3035/actuator/health检查服务健康状态,示例响应如下所示,如果未启用监控,可通过检查进程 PID 判断健康。{
"status": "UP",
"components": {
"diskSpace": {
"status": "UP",
"details": {
"total": 3939047620608,
"free": 393134940160,
"threshold": 10485760,
"path": "/home/daguozb/package2/tapdata/.",
"exists": true
}
},
"ping": {
"status": "UP"
},
"ssl": {
"status": "UP",
"details": {
"validChains": [],
"invalidChains": []
}
}
}
}
可用指标
TapData 以 Prometheus 格式暴露指标,支持各类采集工具分析与告警。各组件的指标端点如下:
- TapData Management:
http://127.0.0.1:3030/actuator/prometheus - TapData Flow Engine:
http://127.0.0.1:3035/actuator/prometheus - TapData Agent:
http://127.0.0.1:3036/metrics - TapData ApiServer:
http://127.0.0.1:3080/metrics
详细指标清单(单击展开)
TapData Management
| 指标名称 | 描述 |
|---|---|
| up | 进程存活状态 |
| disk_free_bytes | 磁盘剩余可用容量(字节) |
| disk_total_bytes | 磁盘总容量(字节) |
| http_server_requests_active_seconds_count | 当前活跃请求总数 |
| http_server_requests_active_seconds_sum | 当前活跃请求累计耗时(秒) |
| http_server_requests_active_seconds_max | 当前活跃请求最大耗时(秒) |
| http_server_requests_seconds_count | 累计请求总数 |
| http_server_requests_seconds_sum | 累计请求处理时间 |
| process_cpu_time_ns_total | JVM 的 CPU 使用时间 |
| process_cpu_usage | JVM 的 CPU 使用率 |
| process_files_open_files | JVM 打开的句柄数 |
| system_cpu_count | 系统 CPU 数量 |
| system_cpu_usage | 系统 CPU 使用率 |
| system_load_average_1m | 最近 1 分钟系统平均负载 |
| jvm_memory_used_bytes | 特定内存区域当前使用量(字节)。区域包括 Heap(G1 Eden、G1 Old Gen、G1 Survivor)和 Nonheap(CodeCache、Compressed Class、Metaspace) |
| jvm_buffer_memory_used_bytes | 直接内存(Direct Memory)使用量 |
TapData Flow Engine
| 指标名称 | 描述 |
|---|---|
| up | 进程存活状态 |
| disk_free_bytes | 磁盘剩余可用容量(字节) |
| disk_total_bytes | 磁盘总容量(字节) |
| process_cpu_time_ns_total | JVM 的 CPU 使用时间 |
| process_cpu_usage | JVM 的 CPU 使用率 |
| process_files_open_files | JVM 打开的句柄数 |
| system_cpu_count | 系统 CPU 数量 |
| system_cpu_usage | 系统 CPU 使用率 |
| system_load_average_1m | 最近 1 分钟系统平均负载 |
| jvm_memory_used_bytes | 特定内存区域当前使用量(字节)。区域包��括 Heap(G1 Eden、G1 Old Gen、G1 Survivor)和 Nonheap(CodeCache、Compressed Class、Metaspace) |
| jvm_memory_committed_bytes | JVM 已分配内存(字节) |
| jvm_buffer_memory_used_bytes | 直接内存(Direct Memory)使用量 |
TapData Agent
| 指标名称 | 描述 |
|---|---|
| up | 进程存活状态 |
| disk_free_bytes | 磁盘剩余可用容量(字节) |
| disk_total_bytes | 磁盘总容量(字节) |
| process_cpu_time_ns_total | CPU 使用时间 |
| process_cpu_usage | CPU 使用率 |
| process_files_open_files | 句柄数 |
| system_cpu_count | 系统 CPU 数量 |
| system_cpu_usage | 系统 CPU 使用率 |
| system_load_average_1m | 最近 1 分钟系统平均负载 |